Mayak Nuclear Industrial Complex (South Urals) |
Scenario |
In May 1946, work on the construction of a nuclear-industrial complex in the province of Cheryabinsk (southern Urals), known as the Mayak Production Association (MPA), was started for the production of weapons-grade plutonium. The MPA comprised of a radiochemical separation plant (Facility B), isotpe plants and uranium-graphite reactors (Facility A), and started production in 1948. The use of new and hazardous technologies and inadequate construction materials resulted in extremely high radiation exposures of the workers especially during the early years of operation. At Facility A, the main source of external exposure was gamma-radiation. During the years 1949 to 1953, about 1600 workers received an average annual dose of 326 mSv. The average total dose was 1220 mSv. At Facility B (about 2500 workers), the average annual dose was 700 mSv and the average total dose was 2450 mSv. In this group, the workers were exposed to external gamma-irradiation and 239Pu aerosols. Due to the release of about 76×106m3 of liquid waste radioactive fission products with a total of 1017 Bq from Mayak facility into the Techa River (between 1949 and 1956), a large number of resident of the riverside area have been exposed externally to 137Cs and internally predominantly to 90Sr (cited from Salassidis et al., Int. J. Radiat. Biol., 74:431-439, 1998). Several studies have been performed to examine chromosome aberration frequencies in peripheral blood lymphocytes of the industrial workers and the residents in the vicinity of Techa River to see the reliability of the documented dose mostly by the use of translocation assay by FISH chromosome painting technology as listed below. As in the case of Chernobyl cleanup workers, they are unanimously raised a problem of discrepancy between chromosome-based dose and physically evaluated documented dose, such as no clear dose-response relationship and/or severely suppressed chromosome aberration level as compared to physically documented doses. |
[1] Mayak industrial workers (Salassidis et al. 1998) |
Chromosome aberration analysis |
The frequencies of symmetrical translocations in blood lymphocytes were examined by FISH painting (1, 4, 12 whole chromosome probes) in 75 Mayak workers who hade received their main radiation exposures between 1948 and 1963. A group of 33 healthy unexposed persons from non-contaminated areas of the Southern Urals, aged 45-74 years (mean 59±8) was used as control. In the pooled data set, translocation frequencies showed a significant dependence on cumulative external gamma-ray doses, but with suppressed rate as compared with the frequencies in the in vitro experiment. The uptake of 239Pu had no substantial influence. |
Reference |
Salasaidis, K., Braselmann, H., Okladnikova, N. D., Pressl, S., Stephan, G., Snigiryova, G. and Bauchinger, M. (1998): Analysis of symmetrical translocations for retrospective biodosimetry in radiation workers of the Mayak nuclear-industrial complex (Southern Ural) using FISH-chromosome painting. Int. J. Radiat. Biol., 74:431-439. |
. | ||||||||||||||||
Subject | Age | Sex | Exposed dose | No. of | FG | Subject | Age | Sex | Exposed dose | No. of | FG | |||||
ID | (year) | (M;F) | External (Gy) | Internal:Pu (kBq) | cells | tr/100 cells | ID | (year) | (M;F) | External (Gy) | Internal:Pu (kBq) | cells | tr/100 cells | |||
1 | 65 | M | 0.02 | 1.99 | 436 | 1.5 | 25 | 71 | F | 3.09 | 0.56 | 680 | 1.4 | |||
2 | 65 | M | 0.02 | 1.48 | 610 | 0.0 | 26 | 65 | F | 3.10 | 9.84 | 1,032 | 0.3 | |||
3 | 63 | M | 0.12 | 1.85 | 418 | 2.3 | 27 | 65 | F | 3.31 | 0.37 | 1,015 | 4.4 | |||
4 | 53 | M | 0.24 | 2.07 | 380 | 3.3 | 28 | 70 | F | 3.35 | 0.33 | 933 | 0.7 | |||
5 | 65 | M | 0.32 | 0.52 | 456 | 1.4 | 29 | 66 | M | 3.76 | 10.50 | 568 | 4.5 | |||
6 | 64 | M | 0.79 | 0.41 | 497 | 0.6 | 30 | 68 | F | 3.80 | 0.63 | 541 | 3.3 | |||
7 | 67 | F | 0.91 | 0.41 | 688 | 1.8 | 31 | 67 | M | 3.91 | 2.80 | 565 | 3.9 | |||
8 | 68 | M | 1.03 | 4.40 | 771 | 2.1 | 32 | 68 | M | 4.05 | 0.81 | 523 | 4.8 | |||
9 | 63 | F | 1.13 | 0.51 | 861 | 0.4 | 33 | 63 | F | 4.07 | 0.41 | 502 | 1.9 | |||
10 | 71 | F | 1.13 | 6.96 | 990 | 0.6 | 34 | 67 | M | 4.11 | 11.47 | 690 | 2.3 | |||
11 | 69 | F | 1.18 | 0.55 | 427 | 0.7 | 35 | 67 | M | 4.20 | 0.77 | 452 | 3.5 | |||
12 | 63 | F | 1.38 | 0.92 | 530 | 3.0 | 36 | 63 | F | 4.27 | 0.85 | 792 | 6.0 | |||
13 | 60 | M | 1.67 | 1.44 | 716 | 0.9 | 37 | 62 | F | 4.75 | 0.55 | 450 | 2.1 | |||
14 | 65 | F | 1.73 | 0.33 | 586 | 1.6 | 38 | 68 | F | 4.75 | 1.07 | 985 | 2.6 | |||
15 | 68 | F | 1.79 | 0.44 | 735 | 2.2 | 39 | 66 | M | 4.98 | 0.55 | 470 | 1.3 | |||
16 | 68 | M | 1.98 | 0.51 | 521 | 1.8 | 40 | 68 | F | 4.99 | 0.44 | 392 | 0.0 | |||
17 | 71 | F | 2.04 | 0.26 | 438 | 0.0 | 41 | 66 | M | 5.01 | 2.18 | 665 | 1.4 | |||
18 | 78 | M | 2.36 | 0.70 | 503 | 1.9 | 42 | 66 | M | 5.77 | 0.70 | 481 | 0.0 | |||
19 | 68 | M | 2.47 | 1.15 | 796 | 1.2 | 43 | 65 | F | 5.96 | 0.74 | 525 | 1.2 | |||
20 | 68 | M | 2.70 | 0.74 | 481 | 4.6 | 44 | 68 | F | 6.29 | 0.33 | 562 | 1.1 | |||
21 | 70 | F | 2.75 | 0.52 | 508 | 2.5 | 45 | 67 | F | 6.38 | 0.55 | 522 | 3.6 | |||
22 | 70 | M | 2.90 | 0.88 | 139 | 4.6 | 46 | 70 | M | 9.47 | 1.48 | 434 | 5.8 | |||
23 | 69 | M | 2.98 | 2.62 | 500 | 0.0 | 47 | 67 | M | 9.75 | 14.80 | 657 | 2.9 | |||
24 | 66 | F | 3.03 | 1.22 | 213 | 3.0 | 48 | 66 | M | 9.91 | 14.80 | 280 | 3.4 | |||
. |
Comentary: |
![]() |
[2] Mayak industrial workers (Burak et al. 2001) |
Chromosome aberration analysis |
The frequencies of symmetrical translocations in blood lymphocytes were examined by FISH painting (1,2,4 chromosome probes) in 27 workers at the MPA facilities. Blood samples were taken in 1996. Also blood samples were taken from two individuals residing in Ozyorsk, who dis not work in radiation-related jobs. Translocation (FG-Tr) increased with doses, but with the rate substantially lower than that in the in vitro irradiation. |
Reference |
Burak, L. E., Kodama, Y., Nakano, M., Ohtaki, K., Itoh, M., Oklandnikova, N. D., Vasilenko, E. K., Cologne, J. B. and Nakamura, N. (2001): FISH examination of lymphocytes from Mayak workers for assessment of transloction induction rate unde chronic radiation exposures. Int. J. Radiat. Biol., 77:901-908. |
. | ||||||||||||
Subject | Age | Sex | Dose | No. of | Aberrations* | |||||||
ID | (years) | (M,F) | Gamma (Gy) | Pu (kBq) | cells | t | ins | cx | dic | FG(%) | ||
1 | 66 | M | 4.2 | 1.147 | 500 | 10 | 0 | 2 | 1 | 6.7 | ||
2 | 69 | M | 1.32 | 0.74 | 500 | 4 | 0 | 0 | 0 | 2.2 | ||
3 | 66 | M | 1.24 | 1.295 | 500 | 10 | 0 | 0 | 0 | 5.5 | ||
4 | 66 | F | 4.85 | 4.699 | 500 | 10 | 0 | 0 | 1 | 5.6 | ||
5 | 80 | F | 1.14 | 1.406 | 499 | 9 | 0 | 0 | 0 | 5.1 | ||
6 | 69 | M | 3.64 | 1.554 | 500 | 10 | 0 | 0 | 0 | 5.5 | ||
7 | 66 | F | 3.14 | 1.184 | 499 | 8 | 0 | 0 | 0 | 4.5 | ||
8 | 65 | F | 6.91 | 0 | 494 | 10** | 0 | 0 | 2 | 5.7 | ||
9 | 73 | M | 0.72 | 0 | 500 | 4 | 0 | 0 | 0 | 2.2 | ||
10 | 71 | M | 1.22 | 0.444 | 500 | 7 | 0 | 0 | 1 | 3.9 | ||
11 | 66 | M | 7.91 | 1.702 | 500 | 7 | 0 | 1 | 1 | 4.4 | ||
12 | 67 | M | 7.46 | 2.442 | 500 | 19 | 1 | 0 | 0 | 11.1 | ||
13 | 79 | M | 8.5 | 0.333 | 500 | 22 | 0 | 0 | 0 | 12.2 | ||
14 | 72 | F | 3.57 | 0.259 | 500 | 13 | 0 | 0 | 0 | 7.3 | ||
15 | 69 | F | 1.61 | 0.666 | 500 | 3 | 0 | 0 | 0 | 1.7 | ||
16 | 69 | F | 2.09 | 16.65 | 500 | 18 | 0 | 0 | 1 | 10.1 | ||
17 | 68 | F | 0.13 | 0.666 | 500 | 1 | 0 | 2 | 1 | 1.2 | ||
18 | 68 | F | 5.38 | 1.813 | 500 | 11 | 1 | 0 | 0 | 6.7 | ||
19 | 70 | F | 1.17 | 0 | 500 | 6 | 0 | 0 | 0 | 3.4 | ||
20 | 56 | F | 0 | 0 | 500 | 3 | 0 | 0 | 0 | 1.7 | ||
21 | 61 | M | 0 | 0 | 499 | 4 | 0 | 0 | 0 | 2.2 | ||
22 | 69 | M | 0 | 0 | 500 | 6 | 0 | 0 | 0 | 3.3 | ||
23 | 68 | F | 2.71 | 0.777 | 500 | 7 | 0 | 0 | 0 | 3.9 | ||
24 | 57 | M | 0 | 0.259 | 500 | 3 | 1 | 0 | 0 | 2.2 | ||
25 | 64 | F | 0 | 0 | 500 | 5 | 0 | 0 | 0 | 2.8 | ||
26 | 57 | M | 0 | 0 | 500 | 5 | 0 | 0 | 0 | 2.8 | ||
27 | 72 | F | 1.34 | 2.072 | 499 | 12 | 0 | 3 | 1 | 8.4 | ||
28 | 55 | M | 0 | 0 | 500 | 2 | 0 | 0 | 0 | 1.1 | ||
29 | 72 | F | 3.69 | 0.148 | 499 | 9 | 1 | 0 | 0 | 5.6 | ||
*) t: translocation. Ins: insertion. Cx: complex. Dic: dicentric. FG: genome equivalent stable translocation. | ||||||||||||
**) Seven translocations were identical (clonal) and therefore counted as one translocation. | ||||||||||||
. |
Comentary: The right panel is a reassessment by auto-regressive moving window averaging (ARMWA) added for additional information during the data compilation. They are solely on our responsibility and do not necessary reflect the conclusion of the authors. |
![]() |
[3] Mayak industrial workers (Bauchinger et al. 2001) |
Chromosome aberration analysis |
This is a collaborative exercise of four laboratories for the use of FISH technology in the retrospective biodosimetry. Chromosome analysis was carried out in blood lymphocytes from 69 Mayak nuclear industrial workers. Blood samples were taken in 1997-1999 in FIB1 (Public Health Ministry of the Russian Federation, Chelyabinsk), chromosome preparations were made in MIRID (Moscow Research Institute of Diagnostic and Surgery, Moscow), coded samples with fixed cells were sent to GSF (National Research Center for Environment and Health, Neuherberg), and they were distributed to four participating laboratories (UK, Netherlands, Germany and Russian Federation) to perform collaborative exercise. The stable chromosome translocations were examine by FISH painting method (1,4,8 chromosome probes). The chromosomally estimated doses were mainly lower than those predicted from in vitro calibration curve. |
Reference |
Bauchinger, M., Braselmann, H., Savage, J. R. K., Natarajan, A. T., Terzoudi, G., Pantelias, G. E., Darroudi, F., Figgitt, M., Griffin, C. S., Knekr, S., Oklandnikova, N. D., Santos, S. and Snigiryova, G. (2001): Collabortive exercise on the use of FISH chromosome painting for retrospective biodosimetry od Mayak nuclear-industrial personnel. Int. J. Radiat. Biol., 77:259-267. Cf. |
|
![]() Comentary: The above is a reassessment by auto-regressive moving window averaging (ARMWA) added for additional information during the data compilation. They are solely on our responsibility and do not necessary reflect the conclusion of the authors. |
[4] Mayak industrial workers (Oklandnikova et al. 2005) |
Chromosome aberration analysis |
Lymphocyte chromosome analysis was carried out on 79 plutonium workers with 239Pu body burden ranging from 0 to 15.5 kBq. Stable, unstable and total aberrations increased as the 239Pu body burden increased over the range 0-4.5 kBq. However, above this rnge little additional increase was observed. Unstable, but not stable, aberrations were correlated with external gamma radiation dose. |
Reference |
Okladnikova, N. D., Scott, B. R., Tokarskaya, Z. B., Zhuntova, G. V., Khokhoryakov, V. F., Syrchikov, V. A. and Grigoryeva, E. S. (2005): Chromosomal aberrations in lymphocytes of peripheral blood among Mayak facility workers who inhaled insoluble from of 239Pu. Radiat. Prot. Dosimet., 113:3-13. |
Chromosome aberration frequencies against 239Pu body burden (adopted from Oklandnikova et al. 2005) |
[5] Mayak industrial workers (Sotnik et al. 2014) |
Chromosome aberration analysis |
Chromosome translocations in lymphocytes were analyzed by multi-color fluorescence in situ hybridization (mFISH) method for 60 Mayak PA workers (42 males and 18 females). Their mean exposure conditions were 1.41±1.12 Gy for external gamma-rays with its red bone marrow (RBM) absorbed dose of 0.87±0.76 Gy, and 2.54±4.27 kBq for 239Pu body burden with its internal absorbed dose by alpha particles to the red bone marrow of 0.10±0.18 Gy. Their duration of employment at Mayak PA was 30.0±13.7 years. Majority (84%) of workers were exposed to mixed external gamma-rays and internal plutonium. The control group consisted of 15 Ozyorsk residents (8 males and 7 females; mean age of 62.4±12.5 years). They have not worked with ionizing radiation sources, not involved in cleanup activity and not lived in the contaminated regions. |
Reference |
Sotnik, N. V., Osovets, S. V., Scherthan, H. and Azizova, T. V. (2014): mFISH analysis of chromosome aberrations in workers occupationally exposed to mixed radiation. Radiat. Environ. Biophys., 53:347-354. |
Dose-response profiles |
A: Translocation frequencies against absorbed
RBM dose from external gamma-rays. B: Complex aberration frequencies against
239Pu body burden. |
[6] Mayak industrial workers (Sotnik et al. 2015) |
Chromosome aberration analysis |
The reliability, usefulness and validation of translocation assay for retrospective biodosimetry by FISH painting technology have been tested in Mayak nuclear industrial workers. Blood samples were collected from 94 workers between 2005 and 2008, and translocation frequencies were examined by FISH chromosome painting in three laboratories (Southern Urals Biophysics Institute, Chelyabinsk; Public Health England, Oxford, and Leiden University, Leiden). The chromosomally estimated dose (DFISH)
based on in vitro calibration for
gamma-rays was reasonably consistent with that in red marrow dose (Dfilm) calculated from the film badge reading (external gamma-rays). |
Reference |
Sotnik, N. V., Azizova, T. V., Darroudi, F., Ainsbury, E. A., Moquet, J. E., Fomina, J., Lloyd, D. C., Hone, P. A. and Edwards, A. A. (2015): Verification by the FISH translocation ssay of historic doses of Mayak workers from external gamma radiation. Radiat. Environ. Biophys., 54:445-451. |
|
![]() Ralationship between BM dose corresponding to film-bage reading and FISF based dose |
[7] Mayak industrial workers (Hande et al. 2003; Mitchell et al. 2004; Hande et al. 2005); mFISH/mBAND |
Chromosome aberration analysis |
The mFISH/mBAND technology was applied to the Mayak industrial workers. Usually FISH-painting is applied to paint 1, 2 or 3 pairs of whole chromosomes together with centromere staining. Thus, the FISH painting visualizes symmetric (translocation) and asymmetric (dicentric) interchromosomal 
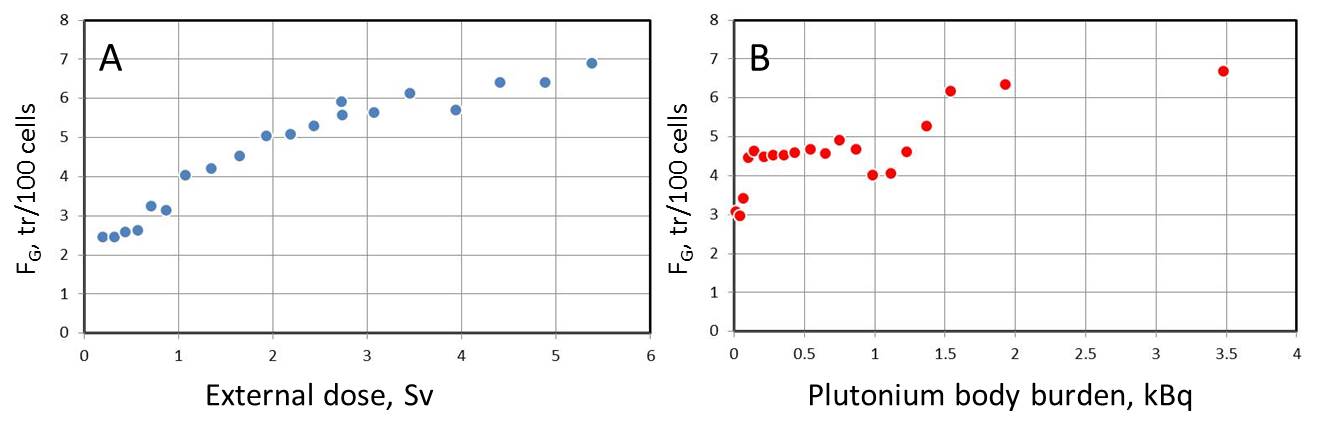
interchanges as a color switch. The scored aberrations can often be converted to the genome-equivalent frequencies, FG, considering the relative physical size of the painted chromosomes. The mFISH enable to distinguish all 23 pairs of chromosomes, and mBAND is the method to see longitudinal differentiation of a chromosome. mFISH may give the genome wide interchromosomal interchanges directly, and mBAND gives the frequencies of intrachromosomal interchanges, i.e., number of 
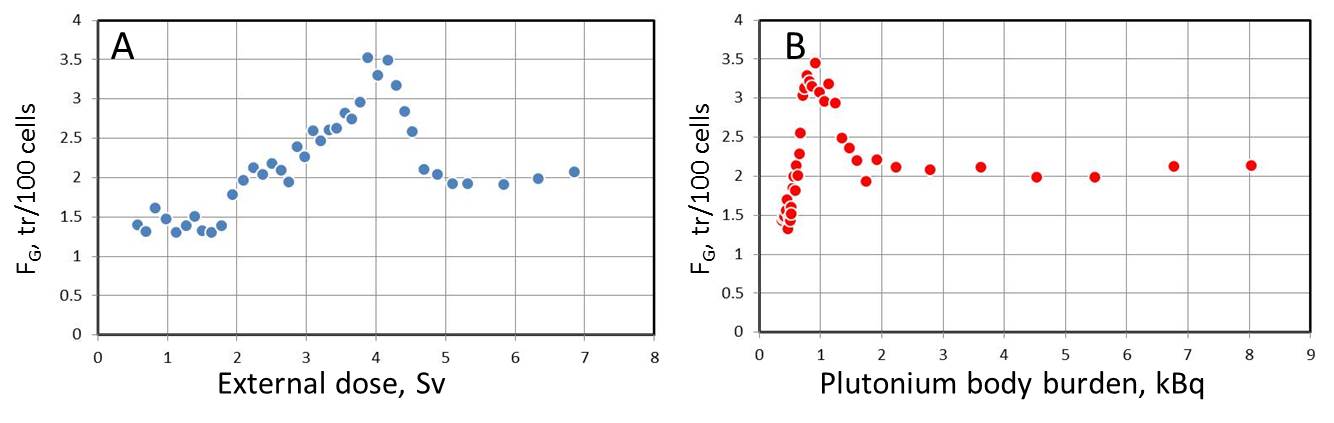
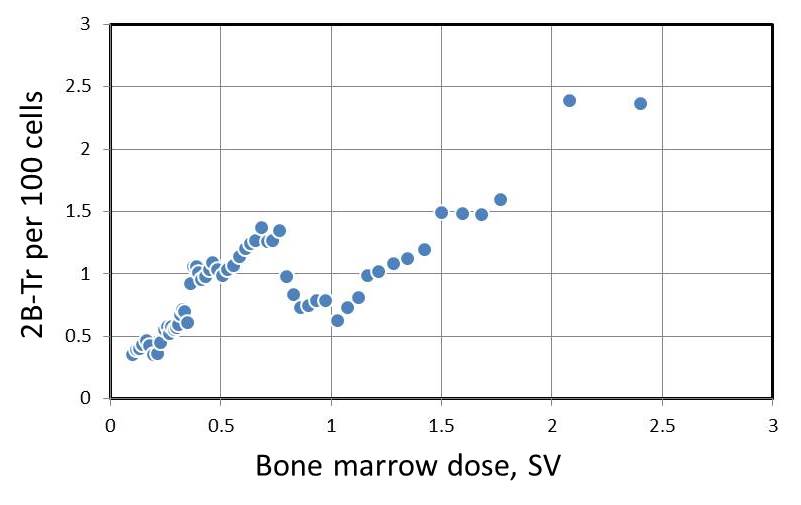
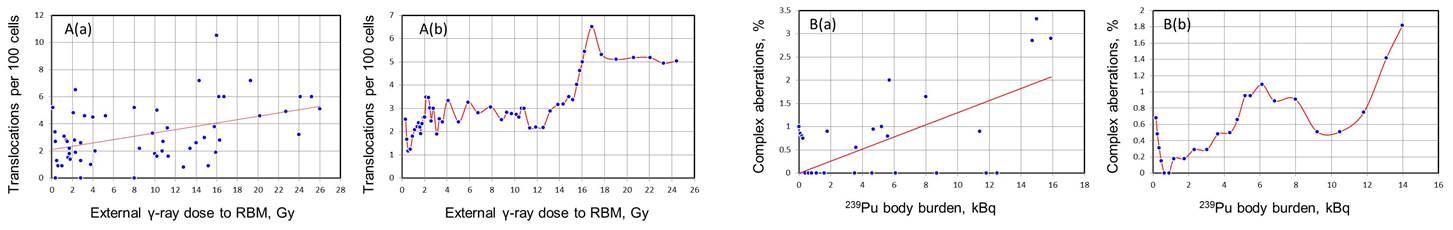
two-break events per base pairs of DNA. The intrachromosomal interchanges, mBAND aberrations, are more readily induced by high LET radiations, such as alpha-particles. Indeed, the mBAND aberrations were confirmed to increase in response to 
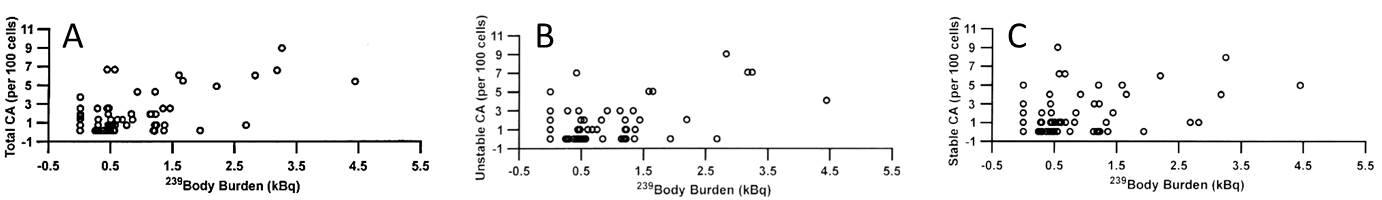
plutonium (alpha-emitter) body burden in the Mayak industrial workers. Similarly, complex translocations increase in proportion to plutonium dose to bone marrow of the Mayak workers. |
Reference |
Hande, M. P., Azizova, T. V., Geard, C. R.,
Burak, L. E., Mitchell, C. R., Khokhryakov, V. F., Vasilenko, E. K. and
Brenner, D. J. (2003): Past exposure to densely ionizing radiation leaves
a unique permanent signature in the genome. Am. J. Hum. Genet., 72:1162-1170. |
. | |||||||||||||||||||||
Aberrations observed in chromosome 1 by mBAND | Aberrations observed in chromosome 2 by mBAND | ||||||||||||||||||||
Group of subjects | Intrachromosomal aberrations | Other aberrations | Intrachromosomal aberrations | Other aberrations | |||||||||||||||||
by BM dose | No. of | No. of | paracentric | Pericentric | Complex | Interstitial | Terminal | No. of | No. of | paracentric | Pericentric | Complex | Interstitial | Terminal | |||||||
individuals | cells | inversion | inversion | inversion | deletion | deletion | Insertion | Translocation | individuals | cells | inversion | inversion | inversion | deletion | deletion | Insertion | Translocation | ||||
High Pu | 8 | 1,012 | 2 | 1 | 2 | 13 | 6 | 0 | 9 | 9 | 1,203 | 1 | 2 | 1 | 13 | 6 | 0 | 10 | |||
Pu≥0.4Gy | 8 | 1,093 | 3 | 1 | 1 | 11 | 2 | 2 | 6 | 9 | 1,229 | 0 | 3 | 1 | 7 | 2 | 0 | 8 | |||
High γ | 10 | 1,281 | 0 | 2 | 0 | 0 | 1 | 0 | 11 | 10 | 1,404 | 0 | 0 | 0 | 0 | 4 | 0 | 10 | |||
γ≥1.5Gy | 10 | 1,328 | 0 | 1 | 0 | 0 | 0 | 0 | 6 | 10 | 1,413 | 1 | 3 | 0 | 1 | 3 | 1 | 8 | |||
Moderate Pu and γ | 4 | 497 | 0 | 0 | 0 | 0 | 0 | 0 | 3 | 3 | 412 | 0 | 0 | 0 | 0 | 1 | 0 | 3 | |||
Pu<0.4Gy; γ<0.4Gy | 4 | 500 | 0 | 0 | 0 | 1 | 0 | 0 | 6 | 3 | 436 | 0 | 0 | 0 | 2 | 1 | 0 | 2 | |||
Controls | 4 | 561 | 0 | 0 | 0 | 0 | 0 | 0 | 1 | 5 | 681 | 0 | 0 | 0 | 2 | 0 | 0 | 4 | |||
4 | 574 | 0 | 0 | 0 | 1 | 0 | 0 | 2 | 5 | 696 | 0 | 0 | 0 | 1 | 0 | 0 | 4 | ||||
. |
. | ||||||||
Subject | Bone marrow | mFISH | mBAND (chromosome 5) | |||||
plutonium dose | No. of | Complex | No. of | No. of | ||||
(Gy) | cells | Translocations | cells | intrachromosomal aberrations | ||||
High plutonium | 1 | 2.08 | 136 | 4 | 135 | 9 | ||
2 | 2.00 | 126 | 2 | 125 | 5 | |||
3 | 1.27 | 108 | 4 | 115 | 5 | |||
4 | 1.21 | 131 | 5 | 135 | 5 | |||
5 | 1.13 | 144 | 9 | 141 | 7 | |||
6 | 1.02 | 106 | 3 | 110 | 6 | |||
7 | 0.94 | 135 | 5 | 147 | 2 | |||
8 | 0.89 | 129 | 3 | 145 | 2 | |||
9 | 0.77 | 120 | 2 | 126 | 5 | |||
10 | 0.64 | 153 | 3 | 157 | 5 | |||
11 | 0.44 | 126 | 1 | 152 | 4 | |||
Moderate plutonium | 12 | 0.33 | 110 | 0 | 111 | 0 | ||
13 | 0.17 | 113 | 0 | 127 | 2 | |||
14 | 0.14 | 110 | 0 | 110 | 2 | |||
15 | 0.11 | 111 | 1 | 110 | 0 | |||
. |